

Formulate strategies. Intelligently.
Make more informed strategic decisions. Econometric analysis helps you better understand your activities, your customers and the market, thus improving your future decision making.
Econometric analysis helps you
-
Analyse the effectiveness of each channel in your media mix.
-
Predict the expected impact of future campaigns.
-
Get rid of assumptions regarding media mix effectiveness.
-
Improve your media mix.
-
Save up to 20 % of your media budget. Reallocate it for a bigger impact.
-
Determine the impact of distribution channels and price promotions on sales.
-
Analyse the influence of competitors’ campaigns on your sales.
-
Analyse the impact of external factors on sales.
Interactive dashboard: a part of the outcome of the econometric analysis describing the influence of marketing factors on sales of different product variants. You can see the breakdown of sales across different products, various distribution channels and in a chosen period.
Econometrics?
Econometrics is a field that explains economic relations through the use of economics, mathematics and statistics. It works with datasets worth of historical data, independent and dependent variables. The independent variables include media mix impressions (both you and your competitors), macroeconomic indicators, and other relevant factors; all on the weekly basis. The dependent variable is then business results – most frequently sales, but also a number of leads, store visits etc. To explore these data, we nonlinear multiple regression analysis using Google Analytics, Keboola or programming languages R and Python.


Insightful econometric analysis requires both experience in strategic marketing planning, and econometrics itself. For the technical side of econometrics we have partnered up with data scientist Lukas Veverka. Lukas has worked in Publicis Group where he’s developed econometric analysis for the biggest brands within finances, FMCG or pharmacy. He currently deepens his expertise in econometrics through PhD studies at Prague University of Economics and Business.
Marketing decision making without insightful data is just as incomplete as big data without marketing expertise. That’s why we believe that this collaboration is the best way to deliver useful insights for brands’ future decision making.
Case study
Description
- The following case study is an analysis of an anonymous brand within the financial sector. We examine two financial products separately, but also within their mutual relationship across three and a half years with weekly data.
- The goal of the analysis was to determine the factors influencing the acquisition of new clients and to define future managerial recommendations.
- Entry data
- No. of new clients
- Media mix, both the brand’s and its competitors’
- Interest rates, own and the market’s average
- Webpage visits
- Seasonal factors
Managerial implications
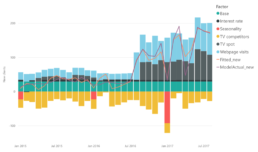
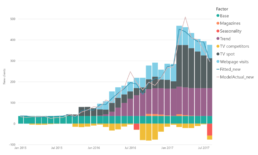
- Media effectiveness: the crucial factors for Product 1 sales are TV campaigns and web visits. As for Product 2, besides TV and web, print ads also contribute to sales.
- Customer journey: TV serves as the first point of contact, builds brand awareness and influences website visits.
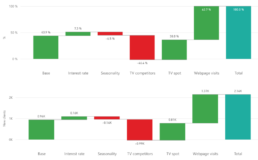
- Selection of media: the recommended approach for TV campaigns is to invest GRP between 200-250 for Product 1, and between 400-450 for Product 2.
- ROPO Effect: 1 out of 4 customers looks up Product 1 online, but purchases offline. For Product 2, on the other hand, ¾ of new customers search online and finish purchases in the branch office.
- Spillover effect: the TV campaigns for Product 1 have a positive influence on the number of new customers for Product 2.
- Baseline (acquisition of new customers irrespective of marketing activities): Product 2 sees an increasing baseline thanks to long-term TV campaigns. Despite the basic hypothesis, this trend is not apparent for Product 1.
- TV campaigns contribute to webpage visits in 38 % of all cases. Webpage visits contribute to the acquisition of new clients in 63,7 % of cases.
- Carry-over effect (the impact of ads in one month on the customer behaviour in the following month) is at 20 %.
- Optimal Gross Rating Point is between 200 and 250 GRP.
- Increase in the baseline due to TV campaigns has not been detected yet despite the hypothesis built on the strength of TV campaigns.
- Webpage visits contribute to the ROPO effect (searching online, buying offline) in 28,4 % of cases.
- Only competitors’ TV campaigns have a negative influence on the acquisition of new clients.
- Competitors’ communication takes up 46,4 % of potential new clients.
- The number of new clients is affected by TV campaigns, website visits and print ads.
- The TV campaigns for Product 1 have a positive effect on the number of new clients for Product 2 (+67 new clients = 1,5 %).
- Long-term campaigns affect the increasing baseline.
- Long carry-over effect for Product 2 enables longer periods between campaigns (2-3 weeks).
- Ideal Gross Rating Points is between 400 and 450 GRP.
- ROPO Effect is at 78 % – approximately 3 out of 4 new customers search for information online and purchase in the branch store.
Interested?
Are you contemplating whether econometric analysis is right for you? Do you want to find out more? Reach out to us, we don’t bite.