


X Ads in 2025: What Works, What Doesn’t—And How to Get the Most Out of It
Some time ago, as an agency, we started looking for ways to partially replace overpriced LinkedIn campaigns. Since X offered a $500 welcome bonus, we decided to give it a try. We launched several campaigns—both for our own self-promotion and for clients—and evaluated the results after two months.
The outcomes pointed us in a clear direction, not just for our own efforts but also for clients who, based on the initial data, are now considering their next moves. In this article, we’ll take a closer look at how Twitter (now X) Ads work, their advantages, and the key challenges every advertiser should keep in mind.
About the X
The platform X, formerly known as Twitter, has been a key space for sharing breaking news and real-time updates since its launch in 2006. The original idea by Jack Dorsey—to create a space where people could post short messages limited to 140 characters—quickly found its audience. Today, users can share posts up to 280 characters long. Thanks to this concise format, X became the go-to tool for politicians, journalists, and influencers to communicate with large audiences.
In 2022, the platform underwent significant changes following its acquisition by Elon Musk, shifting toward a model of more open discussion with minimal content moderation. This decision has both advantages and drawbacks—but in this article, we’ll focus on a different angle. While X.com hosts a wide variety of users, its core audience consists primarily of people aged 25 to 49. It particularly attracts tech enthusiasts, professionals across industries, journalists, and influencers who follow news, trends, and topics like technology, business, politics, or lifestyle.
Since 2014, businesses have also been able to advertise on the platform, opening up new possibilities for targeted marketing. Although X is not as widely used in the Czech Republic as Facebook (only about 4% of internet users—roughly 400,000 people—use X), the platform offers some compelling advertising advantages: targeting can be based on demographics, interests, or real-time conversations, making it a strong choice for reaching active, engaged audiences. In this article, we’ll take a closer look at how to use X Ads effectively—and highlight the key challenges advertisers should be aware of.
Why Consider X Ads?
Direct connection with the target audience: X.com focuses on real-time communication with users actively engaging in current discussions and trends.
Advanced targeting options: The platform allows you to target based on interests, keywords, conversations, and demographics—boosting the relevance of your ads.
Flexible ad formats: X offers various formats such as promoted tweets, carousel ads, and video content.
Measurable results: Robust analytics tools let you track performance and optimize campaigns based on reach and engagement.
Occasional promotional offers: What motivated us—and our clients—to try the platform was a promotional credit. In our case, we spent $250 and received an additional $250 through a coupon, effectively doubling our budget to $500.
Overview of Ad Formats on X
X offers several types of ads that can be tailored to your target market and marketing objectives:
Promoted Ads: These are ideal for reaching users in their feed and attracting attention without disrupting regular content. In 90% of cases, advertisers will use this format. Other formats tend to serve as a complement.
Within Promoted Ads, you can use:
- Image Ads
- Video Ads
- Carousel Ads
- Text Ads
Vertical Video Ads: Essentially, this is a Reels-style format that’s very popular across social media platforms.
Among the many available formats, we can also mention X Amplify, X Takeovers, X Live, Dynamic Product Ads, Collection Ads, and X Ad Features. If you’d like to learn more about each format, visit the official X website.
Campaign Setup and Targeting
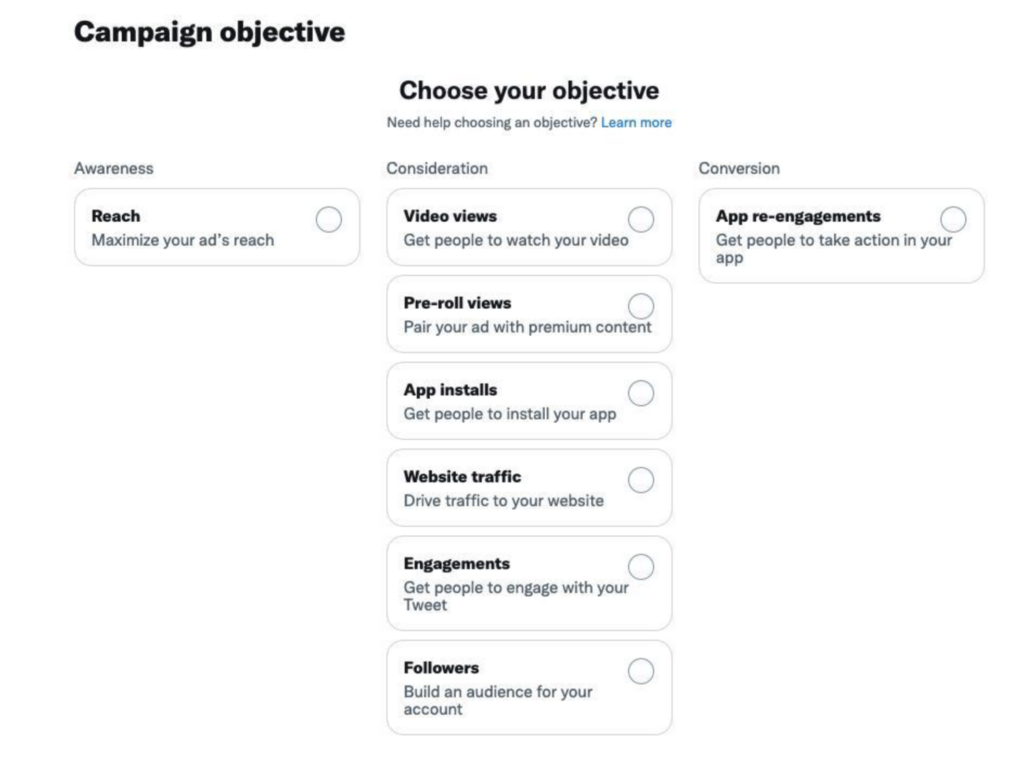
At the beginning, you can choose from three campaign types:
Awareness: Campaigns focused on reach.
Consideration: Ideal for generating interaction with your brand. This campaign type can be further customized with the following objectives:
-
Video views – Generate views for your video content
-
Pre-roll views – Video ads shown before video content
-
App installs – Drive mobile app installations
-
Website clicks – Generate traffic to your website
-
Engagements – Promote interactions with your content
-
Followers – Gain new followers for your account
Conversion: This objective focuses on driving specific actions directly within the app.
Types of Payment, Campaign Flow, and Timing
When setting up a campaign on X, the first step is to select its duration—either for a limited period or with no end date. The next step is choosing the objective fulfillment method. For example, in traffic-focused campaigns, we recommend selecting “site visits” instead of “link clicks.”
This is followed by bid type selection, where you can choose automatic bidding or manually set values for CPM, CPC, etc. As with most platforms, we recommend using Autobid for optimal results. In terms of payment method, both X and we generally suggest using impression-based CPM.
Next is ad placement. X allows ads to be shown in users’ main timelines, on user profiles, and within search results.
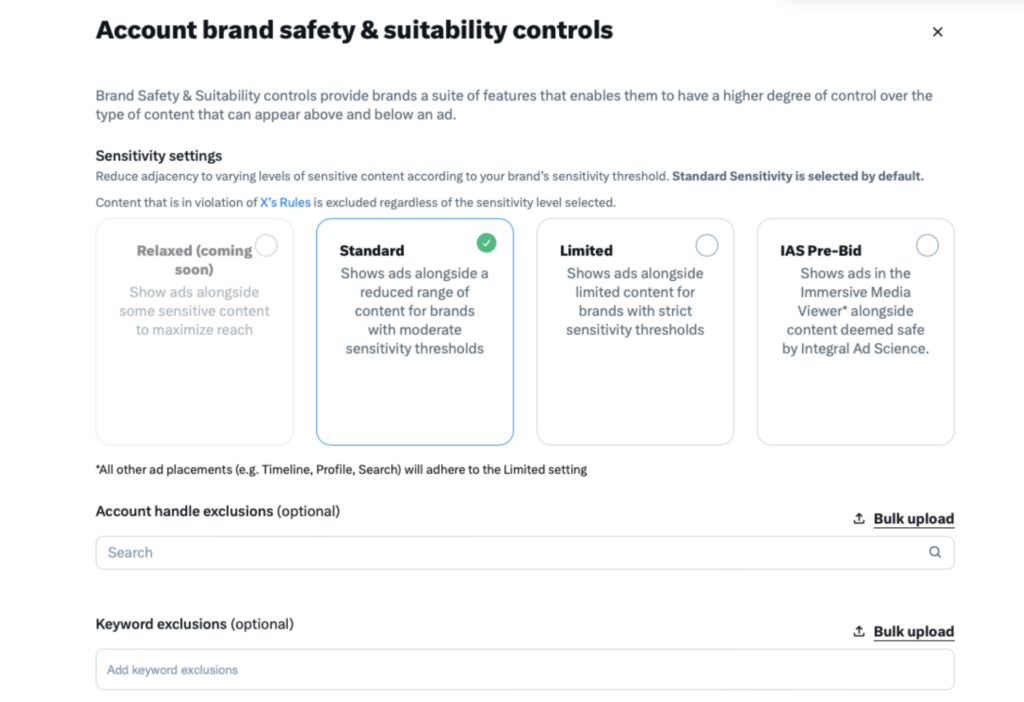
Another important step is the brand safety section, where you can define whether your ad can appear near explicit content—and how explicit that content can be. X is planning to introduce ad placements alongside highly explicit content in the future, which may present a challenge for some advertisers depending on their brand guidelines. As expected, you can also exclude specific accounts or profiles from your targeting.
Comment Restrictions
The X platform allows advertisers to limit or even completely disable comments under ads, which can be a major advantage for certain campaigns.
Ad Targeting
Demographic targeting on X includes geographic options at the level of the entire Czech and Slovak Republics, as well as the ability to select the language your ad is targeting.
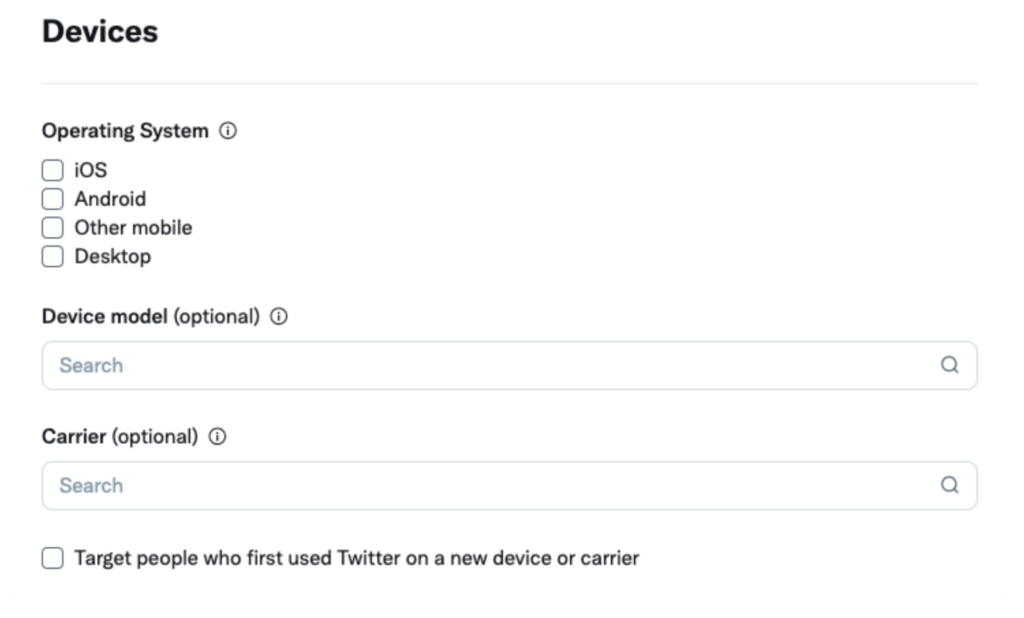
For targeting based on age, gender, and technical specifications—such as device model, operating system, or mobile carrier—X offers several options, including the ability to show ads only on devices connected via Wi-Fi (formerly popular for app download campaigns). You can also target users with new devices.
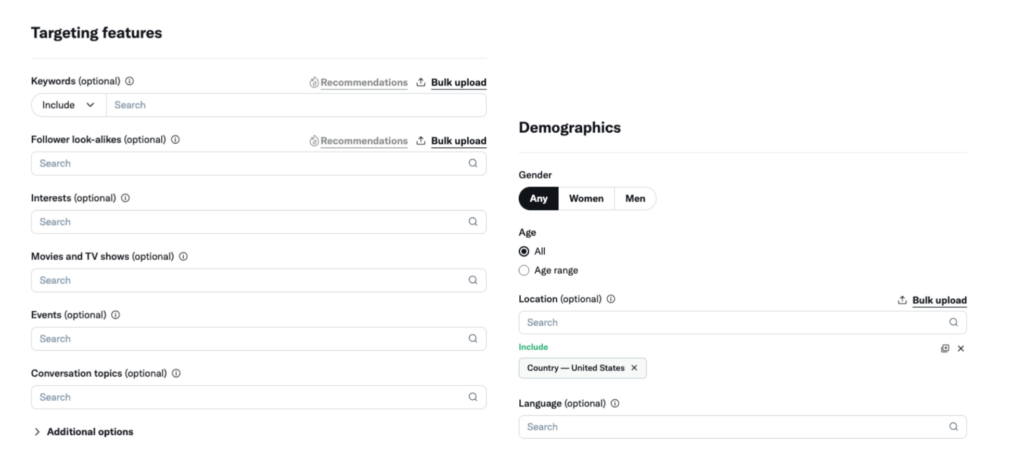
If you want to target conversations, X allows you to choose from over 10,000 topics across 25 categories such as sports, lifestyle, or books. Campaigns can also use keywords that users have typed, interacted with, or searched for on X.
For optimal results, the platform recommends including at least 25 relevant keywords per campaign. X also supports interest-based targeting, divided into 25 main categories and 350 subcategories—maximum effectiveness can be achieved by selecting ten subcategories and evaluating performance continuously.
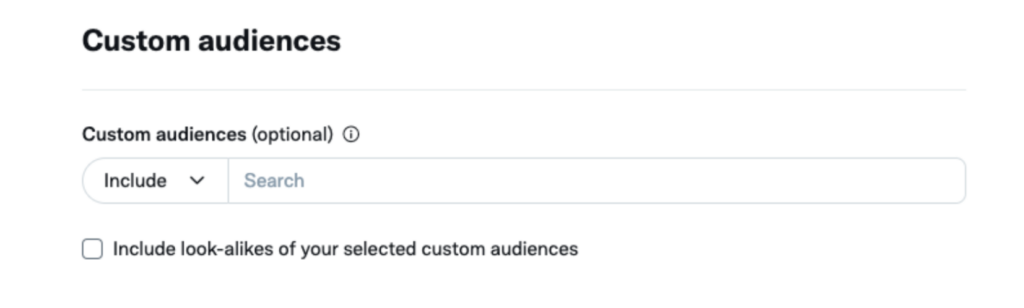
TV content targeting is available abroad, but this option is not currently offered in our region. Another targeting method is audience lookalikes—targeting users who follow a specific account. For example, users following @TwitterBusiness may be interested in advertising on X. It’s recommended to select around 30 relevant accounts, ideally without combining this with interest-based targeting.
We’ve found that running two separate campaigns—one targeting interests and the other targeting followers of specific accounts—works well.
Creating an Ad
The ad creation process is simple and very similar to platforms like LinkedIn or TikTok. You select the format, upload your own creative and write the copy—or choose directly from your existing ad gallery.
Just don’t forget to create a UTM parameter, so your data tracks correctly in Google Analytics.
What Results Have We Seen So Far—and What Do We Think of the Platform?
Our newly gained experience has shown that X Ads deliver pleasantly low cost-per-reach and cost-per-click for B2B campaigns—helping our clients drive solid traffic to their websites, with the occasional conversion along the way.
Even brand awareness campaigns have solid potential here, especially when targeting a qualified, higher-income audience. The cost per reach is significantly lower than on LinkedIn. However, broader targeting can bring in less relevant users as well. One interesting bonus: increased interest from journalists, who often browse X for sources and stories.
From our perspective, X is a valuable addition to the media mix—particularly in certain industries where it deserves attention. It may not be the platform you bet everything on, but it certainly has something to offer. Given its specific user base and high engagement rate, it also provides useful insights into market sentiment and public opinion.
For companies looking for new ways to reach decision-makers or raise brand awareness, X Ads can be a strong tool. We recommend allocating a test budget over 2–3 months—ideally in the lower tens of thousands of CZK—to see what this platform is capable of. Who knows, it might just become your new secret weapon in digital advertising.
Source: https://business.x.com/en/advertising & https://www.cernovsky.cz/marketing/reklama-na-twitteru/

Mental availability as a path to market share growth
Mental availability as a path to market share growth
The more situations in which customers use your product, the more paths to higher revenues and a larger market share open up for your brand. The desired outcome, where customers remember your brand in a specific purchasing situation, is called mental availability. It is no coincidence that the biggest and most successful companies have a very wide portfolio of purchasing situations closely linked to their brand.
Take Coca-Cola, for example. Customers are likely to remember it in situations when they want to refresh themselves on a hot day, when buying non-alcoholic beverages for a family lunch, or when you’re the unlucky one who has to drive home from the bar so that others can drink unrestrained. Coca-Cola is a proponent of well-developed mental availability. Another example is McDonald’s: breakfast, a quick snack on the way home from work, food for a hangover, or a cheat day on Sunday after a healthy week. The more consumption opportunities customers associate with a brand, the greater the potential for brand awareness. Thus, the goal of your marketing department is to build more associations with your brand than with the competition and to regularly maintain these associations.

But how do you build mental availability?
As with any marketing initiative, we should ideally begin with research. You may know your category well enough to identify individual situations in which your product is used, but… do you really want to base a multimillion-dollar marketing activity stretching across several years and shaping your brand’s image on assumptions? Not to mention that research will provide you with data that you cannot easily estimate. Is your main competitor more associated with a purchasing situation you thought you dominated? Or are you perceived more strongly in connection with a situation you had not considered as the main use of your product? Or is your product used in a situation you had no idea about?
The output of marketing research is thus a list of the most common purchasing situations in the market, with various frequencies of occurrence. By frequency of occurrence, we mean the fact that fast foods are indeed used more by people to satisfy a sudden craving for something unhealthy than for breakfast. At the same time, we find out how we compare with the competition. Do customers in your category associate your brand with most purchasing situations, but are you always the third brand they think of? Or are you clearly the first brand, but only in one purchasing situation?
To ensure the entire process of building mental availability is not just a crafty walk through a rose garden, we now come to the hard part. Ideally, we would try to strengthen our position in all purchasing situations at once, but marketing budgets are not infinite, so prioritization comes into play. That is, which one or two purchasing situations will we try to associate with our brand during this period? Do we want to start fighting with competitors for a prominent purchasing situation? Or do we want to strengthen our position in situations that are not so common?
Alright, research. What is next?
How do you make customers remember your brand in the situations you’ve chosen? Simply. You will communicate these situations in connection with your brand. Creativity is important and will definitely help overcome ad blindness; however, it is crucial that the situation is clearly readable from the advertising message. An important aspect is then precisely the connection with the brand through brand elements that are typical for your brand – the logo, slogan, brand face, and others. It is praiseworthy to communicate the purchasing situations in your category, but if the customer does not remember your brand when they are actually in that purchasing situation, then the advertisement has not fulfilled its purpose.
Another key factor is reach. You can clearly communicate purchasing situations and have them perfectly linked with your brand, but if the advertisement does not reach enough people, then the communication again has not fulfilled its purpose—it did not build mental availability with enough people. And although the regularity of communication is immensely important in the short term, if you want your brand to grow, then over the years it is important to focus on a wide range of purchasing situations. Do not continually build an already-established association. This brings us full circle back to research, which will reveal that the time has come to take your brand a step further.
The book How Brands Grow: Part 2 was not only the source of this article, but should also be the foundation for any activities related to mental availability and Category Entry Points.
Mental availability. Let’s get to work.
As you can see, even the article itself on how to build mental availability is full of questions. Answer them together with us and build the mental availability that will open the doors to genuine business growth. Grizzlink has already addressed the question of mental availability with clients such as Vapiano, Business Lease, and Cambridge University Press, helping them achieve measurable results.

Econometrics as a solution to blind spots in your marketing strategy: Grizzlink introduces econometric analysis.
Econometrics as a solution to blind spots in your marketing strategy: Grizzlink introduces econometric analysis.
You have the efficiency of your digital channels sorted thanks to ROI or ROAS, but can’t evaluate the impact of other channels offline? And how to analyse situations where the customers decide to buy your product based on your TV and through Google Ads only finishes the purchase? Based on the ROI in Google Analytics, the impactful channel is Google Ads and TV remains attributeless. Had it not been for it, though, the purchase would’ve never happened. How to approach this?
Grizzlink introduces a product among its analytical services which resolves all these pickles and helps brands make more informed strategic decisions: an econometric analysis.
Up until now, econometrics was mainly the domain of large corporations with deep pockets. Grizzlink strives to level the uneven playing field between David and Goliath and brings this tool not only to large media spenders but also to medium-sized companies whose strategic decisions have been clouded by intelligence blind spots. As with anything in marketing, the econometric analysis should be perceived as an investment, not an expense. Investment improves strategic decision making and strengthens your competitiveness in the long term.

Econometrics?
Econometrics is a field that explains economic relations through the use of economics, mathematics and statistics. It works with datasets worth of historical data, independent and dependent variables. The independent variables include media mix impressions (both you and your competitors), macroeconomic indicators, and other relevant factors; all on the weekly basis. The dependent variable is then business results – most frequently sales, but also a number of leads, store visits etc. To put it simply – the fundamental outcomes of an econometric analysis are the interpretation of the past, streamlining the present and predicting the future. Too ambitious? Read further.
1. Interpretation of the past
Thanks to the analysis of historical activities, we can evaluate which individual channel had the most impact on sales. Without thorough econometric analysis, it is virtually impossible to determine which channels are impactful and to what extent. At the same time, we can detect which channels are simply dead weight ready to be cut out off the media mix. The essential difference between an econometric analysis and an advanced attribution model is that the former does not examine a path to purchase of an individual customer, but works with the whole customer base.
What’s more, we don’t have to limit ourselves to media mix, but we can analyse other factors such as a creative, economic situation or cultural trends. This brings us to the next use of econometric analysis: making the present more effective.
2. More effective present
People best learn from their own mistakes, right? These don’t necessarily have to be mistakes. You could do all the planning by the book but thanks to econometrics you still find out that there is a slightly better split of media for your specific target segment. This way, econometric analysis can save up to 20% of your planned budget and redistribute it for improved effectiveness. Thanks to econometrics the next term will be planned based on real data specific to your segment and your brand. You don’t have to rely on assumptions or best practices for planning anymore.
3. Predicting the future
Thanks to econometrics, you can also predict your key performance indicators based on a specific media mix. Find out what the impact will be if you reallocate 10 % of your media spend to TV campaigns. What the consequences of halting your consumer contests will be. Simultaneously, you will be able to predict the impact of forces outside of your influence which still can have an impact on your business, such as macroeconomic indicators, cultural trends or the impact of weather.
It is noteworthy, however, that all these predictions must be based on historical activities. Although you can foretell the sales volume if you reallocate 10 % of your budget from one channel to another, you cannot predict the impact of adding a new channel, which you haven’t used before.
Case study
Analysis description
- The following case study is an analysis of an anonymous brand within the financial sector. We examine two financial products separately, but also within their mutual relationship across three and a half years with weekly data.
- The goal of the analysis was to determine the factors influencing the acquisition of new clients and to define future managerial recommendations.
- Entry data
- No. of new clients
- Media mix, both the brand’s and its competitors’
- Interest rates, own and the market’s average
- Webpage visits
- Seasonal factors
Main insights
- Media effectiveness: the crucial factors for Product 1 sales are TV campaigns and web visits. As for Product 2, besides TV and web, print ads also contribute to sales.
- Customer journey: TV serves as the first point of contact, builds brand awareness and influences website visits.
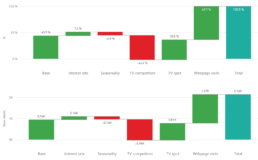
- Selection of media: the recommended approach for TV campaigns is to invest GRP between 200-250 for Product 1, and between 400-450 for Product 2.
- ROPO Effect: 1 out of 4 customers looks up Product 1 online, but purchases offline. For Product 2, on the other hand, ¾ of new customers search online and finish purchases in the branch office.
- Spillover effect: the TV campaigns for Product 1 have a positive influence on the number of new customers for Product 2.
- Base line (acquisition of new customers irrespective of marketing activities): Product 2 sees an increasing baseline thanks to long-term TV campaigns. Despite the basic hypothesis, this trend is not apparent for Product 1.
- TV campaigns contribute to webpage visits in 38 % of all cases. Webpage visits contribute to the acquisition of new clients in 63,7 % of cases.
- Carry-over effect (the impact of ads in one month on the customer behaviour in the following month) is at 20 %.
- Optimal Gross Rating Point is between 200 and 250 GRP.
- Increase in the baseline due to TV campaigns has not been detected yet despite the hypothesis built on the strength of TV campaigns.
- Webpage visits contribute to the ROPO effect (searching online, buying offline) in 28,4 % of cases.

- Only competitors’ TV campaigns have a negative influence on the acquisition of new clients.
- Competitors’ communication takes up 46,4 % of potential new clients.
- The number of new clients is affected by TV campaigns, website visits and print ads.
- The TV campaigns for Product 1 have a positive effect on the number of new clients for Product 2 (+67 new clients = 1,5 %).
- Long-term campaigns affect the increasing baseline.
- Long carry-over effect for Product 2 enables longer periods between campaigns (2-3 weeks).
- Ideal Gross Rating Points is between 400 and 450 GRP.
- ROPO Effect is at 78 % – approximately 3 out of 4 new customers search for information online and purchase in the branch store.

- TV campaigns contribute to webpage visits in 38 % of all cases. Webpage visits contribute to the acquisition of new clients in 63,7 % of cases.
- Carry-over effect (the impact of ads in one month on the customer behaviour in the following month) is at 20 %.
- Optimal Gross Rating Point is between 200 and 250 GRP.
- Increase in the baseline due to TV campaigns has not been detected yet despite the hypothesis built on the strength of TV campaigns.
- Webpage visits contribute to the ROPO effect (searching online, buying offline) in 28,4 % of cases.
- Only competitors’ TV campaigns have a negative influence on the acquisition of new clients.
- Competitors’ communication takes up 46,4 % of potential new clients.
- The number of new clients is affected by TV campaigns, website visits and print ads.
- The TV campaigns for Product 1 have a positive effect on the number of new clients for Product 2 (+67 new clients = 1,5 %).
- Long-term campaigns affect the increasing baseline.
- Long carry-over effect for Product 2 enables longer periods between campaigns (2-3 weeks).
- Ideal Gross Rating Points is between 400 and 450 GRP.
- ROPO Effect is at 78 % – approximately 3 out of 4 new customers search for information online and purchase in the branch store.

Stereotypes in marketing
At the center of any marketing communication there must always stand the customers. However, despite technological advances, we still cannot collect all the data about them. This is why we often make our work easier with a number of projections designed to help us refine our targeting. But we must treat them with caution and verify whether we are not just subject to socially deep-rooted stereotypes in our conclusions.
A good example of stereotyping, for example, is the player of computer games. Many imagine a younger man who spends the whole day at the computer and practically doesn't talk to anyone. Therefore, it can come as a surprise that the statistical representation of men and women among global players is perfectly balanced (year-on-year deviation of +/- 2 %), and with one quarter, we are talking about a persons aged 45 years and older.
It concludes that a stereotypical assumption does not equal statistical data.
Multinational FMCG company Unilever decided to set an example in breaking stereotypes in advertising . Their corporate marketing communication tries to follow social developments and so break the traditional roles and social portraits, which belongs perhaps to the last century, and today, they cannot be arbitrarily applied on consumer behaviour. Already in 2017, they founded an association that connects other organizations, and they all work together to eradicate stereotypes in all advertising formats.
In the video below, you can watch their DNA experiment.
Presenting the two most common stereotypes that interfere with segmentation, now.
Age matters (not)
We often apply a common stereotype in dividing and comparing generations to each other. We attribute to them uniform patterns of behaviour and define their consumer decision-making only on the year of birth basis. We call them inappropriately segments and pair them to one medium, which this or that generation uses most often – for instance, the Digital First approach for Generation Y or Social First approach for Generation Z. However, the generation does not resemble a definition of any segment, by far. You can just look around yourself, how behave those of same age, our peers, and we can notice a surprising thing – our age says nothing about our interests or how we spend our work and leisure time.
Take, for example, millennials. Every once in a while, a study that analyses Generation Y behaviour comes out, but the results don't support what is widely claimed. The behaviour and decision-making of millennials doesn't make a significant difference to previous generations. It is just younger and maybe a little poorer till certain age. Therefore, marketing should perceive age only as a number, that itself says nothing tell, and don't fixate on presumptions. It is the behaviour of each individual itself that should interest us.
Another widespread stereotype then applies to traditional media. We often see them as retreating, with younger generations spending their time on phones alone. Again, statistics say something else. Though, one cannot of course deny that, today, we spend more time on-line than ever before, to underestimate the reach of traditional media would also be a costly mistake. Instead of looking for the most relevant media, we should rather decide in what proportion a suitable mediamix will be compiled.
Mr Blue and Mrs Pink
With the problem of the for some outdated perception of gender roles of men and women today, we still encounter almost everywhere, although the topic itself is not that new. The ways in which these stereotypical roles are reflected in marketing are increasingly causing the opportunity to reach potentially more profitable customers to be missed. Research by the British research agency Kantar suggests that two thirds of women think current ads negatively portray the role of a woman.
Whether we're talking about a social role, or the ways the product is communicated, marketing often overrates whether a customer for a product should be woman or man. Still, in advertising there apply old standards, that the man is the head of the family, at the same time, the technical type, and clueless in the household, while women on the contrary, belong to the house-keeping and in their spare time they buy things they don't need. But that certainly this cannot be applied nowadays, so brands possible forgetting some of their potential customers is based solely on these unfounded assumptions.
But gender stereotypes by far don't concern adults only. Gender marketing among children's toys may be an even bigger problem than among adult products. Division of products in pink and blue or cars for boys and dolls for girls today is a complete standard, which has surpassed the period before 50 years ago, which was generally on far more discriminatory in social norms. Even despite the fact, that according to research, the girls today equally with the boys show interest in the video games and quarter of them won't wear anything pink. For example, the worldwide popular brand Lego decided to test its products by a mixed group, only a few years ago. In doing so, it is clear that such a decision may have previously had a major impact on prototyping products and expanding the portfolio of small customers.
In the year 2018, the British Advertising Standards Authority (ASA) came with the new set of rules, which should the British advertising industry follow in order to eliminate, as much as possible, the negative impact of advertising on the perception of male and female roles in society. But it was rather a first try to point out the fact that old order no longer fits today, and may generally have a negative impact on society.
How do brands try to work with breaking of stereotypes?
In 2019, globally popular sub-brand Diet Coke set out into the world with the campaign Unlabeled – Imagine the World Without Imposed Labels, that tried to tear down stereotypes built around gender roles, ethnic groups or sexuality. It was also a message that not every "label" is bad, it just needs to get to know to the individual more in depth.
In recent days, there has been a wave of reactions in recent triggered by spot of Girls. Girls. Girls magazine "Don't be a Slut. Be a Lady they Said" that shows gender labels and stereotypes associated with the role of a woman in society.
Thus, it tries to provoke a discussion over the absurd demands that are burdened on women, and the impact on their self-esteem. Also the Dove brand has been successfully fighting with this in its ads, for a long time.
https://www.youtube.com/watch?time_continue=1&v=7rM6BOdqORE&feature=emb_logo
How to avoid the mistaken stereotypes?
The difference between targeting a stereotype, and a real group of potential customers is only in data and research implementation. Better prevention of inaccurate segmentation does not exist. As we have showed on several examples, statistics often go in an unexpected direction compared to what we read or hear.